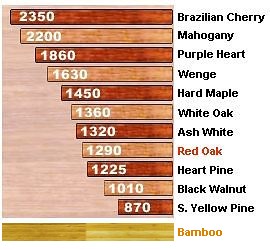
RELATIVE HARDNESS OF
SELECTED WOOD FLOORING SPECIES
(Ranked by Janka hardness rating)
The Janka (or side) hardness test measures the force required
to embed a .444-inch steel ball to half its diameter in wood. It is one of the best
measures of the ability of a wood species to withstand denting and wear.By the same token,
it is also a good indicator of how hard or easy a species is to saw or nail. Northern red
oak, for example, has a Janka hardness rating of 1290. Brazilian cherry, with a rating of
2350, is nearly twice as hard. If you're accustomed to working with red oak and decide to
tackle a job with Brazilian Cherry, you can expect it to be much harder to cut and nail. |
HARDNESS CHART
Click on a Species to view details
 |
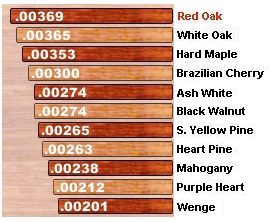
RELATIVE STABILITY OF SELECTED WOOD FLOORING SPECIES
(Ranked by dimensional change coefficient) The numbers in the chart reflect the dimensional
change coefficient for the various species, measured as tangential shrink-age or swelling
within normal moisture content limits of 6-14 percent. Tangential change values will
normally reflect changes in plainsawn wood. Quartersawn wood will usually be more
dimensionally stable than plainsawn.
The dimensional change coefficient can be used to calculate expected
shrinkage or swelling. Simply multiply the change in moisture content by the change
coefficient, then multiply by the width of the board.
Example: A mesquite (change coefficient =
.00129) board 5 inches wide experiences a moisture content change from 6 to 9 percent - a
change of 3 percentage points. Calculation: 3 x .00129= .00387 x 5 = .019 inches.
In actual practice, however, change would be diminished in a complete floor, as the
board's proximity to each other tends to restrain movement. |
The chart is best used for comparison. * Although some tropical woods such as Australian
cypress, Brazilian Cherry, Merbau and Wenge appear in this chart to have excellent
moisture stability compared to domestic oak, actual installations of many of these woods
have demonstrated significant movement in use. To avoid problems later, extra care should
be taken to inform potential users of these tendencies prior to purchase.
STABILITY CHART
Click on a Species to view details
 Source:
Stability ratings taken from Wood Handbook: Wood as an Engineering Material (Agriculture Handbook 72, Forest
Products Laboratory, Forest Service, U.S. Department of Agriculture; revised 1987). Source:
Stability ratings taken from Wood Handbook: Wood as an Engineering Material (Agriculture Handbook 72, Forest
Products Laboratory, Forest Service, U.S. Department of Agriculture; revised 1987). |
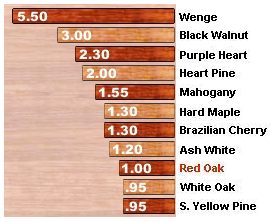
RELATIVE COST OF SELECTED WOOD FLOORING SPECIES
(Based on a cost factor of 1.00 for plainsawn
select red oak) How to use this
chart: Costs for any species may vary according to current availability, location and
other market factors. This chart is intended only to provide a comparison scale. Each
species has been assigned a multiplier to be applied to the cost of plainsawn select red
oak, chosen as the benchmark because of its widespread use in the flooring industry.
Brazilian cherry, for example, has been assigned a cost multiplier of 1.30. If you know
the cost of plainsawn select red oak, multiply by 1.3,and you have some idea what
Brazilian cherry might cost.Please keep in mind, however, that these figures are only
estimates; actual costs can vary greatly by locale, time of year and flooring style. |
RELATIVE
COST CHART
Click on a Species to view details
 |